
数字商品
教育 / 知识
2024年美国大学生数学建模竞赛(A题)| 建模秘籍&文章代码思路大全
数学建模小秘籍 浏览 27 已购 0
商品介绍
赛中更新!全团队打造!
新晋进阶版仓库,内含20+团队一起精细打造的A题详细分析,全文paper(精细校对)与代码逐步细致分析解释。以及各类附件资料压缩包等,助你一臂之力!
🔗点击下方链接购买:
(进阶版!)2024 美国大学生数学建模竞赛(A题)资源可用性和性别比例问题 | 建模秘籍&文章代码思路大全
🎁 现在尽情享受,购买小秘籍!限时特价,仅售88元!明日将涨价,赶紧抢购,助您数模之路更上一层楼!
小秘籍希望大家都能轻松建模呀,美赛也会持续给大家放送思路滴~
抓紧小秘籍,我们出发吧~
铛铛!小秘籍来咯!
小秘籍希望大家都能轻松建模呀,华数杯也会持续给大家放送思路滴~
抓紧小秘籍,我们出发吧~
## 问题重述:
2024年MCM问题A:资源可用性和性别比例
在自然界,有些动物物种存在除了常见的雄性和雌性之外的性别,但大多数物种主要是雄性或雌性。尽管许多物种在出生时表现出1:1的性别比例,但其他物种会偏离均等的性别比例,这被称为适应性性别比例变异。例如,美国鳄鱼的巢穴温度会影响出生时的性别比例。
对于七鳃鳗的角色是复杂的。在一些湖泊栖息地中,它们被视为对生态系统产生重要影响的寄生虫,而在世界一些地区,如斯堪的纳维亚、波罗的海地区以及北美太平洋西北部的一些土著民族中,七鳃鳗也是一种食物来源。
七鳃鳗的性别比例可以根据外部环境而变化。七鳃鳗在幼虫阶段的生长速度决定其性别,而这些幼虫的生长速度受食物可用性的影响。在食物可用性较低的环境中,生长速度较慢,雄性的比例可能达到人口的约78%。而在食物更充足的环境中,雄性的比例观察到约为人口的56%。
我们关注七鳃鳗的性别比例及其对当地条件的依赖性,具体是湖泊或海洋栖息地的七鳃鳗。七鳃鳗生活在湖泊或海洋栖息地,并沿河上迁移产卵。任务是研究一个物种能够根据资源可用性改变其性别比例时,对生态系统中相互作用的影响。
要探讨的问题包括:
- 当鳗鱼种群能够改变其性别比例时,对更大的生态系统有何影响?
- 鳗鱼种群的优势和劣势是什么?
- 鳗鱼性别比例的变化对生态系统的稳定性有何影响?
- 具有可变性别比例的鳗鱼种群是否能够为生态系统中的其他生物(如寄生虫)提供优势?
你的PDF解决方案总页数不得超过25页,包括:
- 一页摘要表。
- 目录。
- 完整解决方案。
- 参考文献列表。
- AI使用报告(如使用,不计入25页总页数限制)。
在报告中,需明确使用的AI工具,包括模型和目的,并在文中引用和在参考文献中列出所有使用的AI工具。如果使用AI工具,请在报告结束后添加一个名为“AI使用报告”的新部分,无页数限制,不计入总页数限制。
## 问题一
当鳗鱼种群能够改变其性别比例时,对更大的生态系统有何影响?
**基于代理的建模详细分析:**
**1. 代理属性定义:**
- **性别(Gender):** 每个鳗鱼个体在模型中具有雄性或雌性属性。
- **年龄(Age):** 代理的年龄属性将随着模拟的时间推移而增长。
- **生长速率(Growth Rate):** 该属性表示个体的生长速度,直接影响代理的性别发展。
**2. 代理行为规则定义:**
- **食物获取(Food Acquisition):** 代理根据环境中的食物可用性采取不同的行为。成功获取食物的代理生长速率增加。
- **繁殖行为(Reproduction):** 代理在适当的年龄和环境条件下进行繁殖。繁殖成功率与性别、年龄有关。
**3. 影响性别比例的因素:**
- **食物可用性(Food Availability):** 模拟中,食物可用性会影响代理的生长速率。更丰富的食物资源可能导致更高的生长速率,从而影响性别比例。
- **年龄(Age):** 特定年龄段可能更容易发展成特定性别。模型中,性别发展概率会随着年龄的增加而变化。
**4. 代理交互规则定义:**
- **竞争(Competition):** 代理之间存在资源竞争和繁殖竞争。竞争因素会影响食物获取和繁殖的成功率,进而影响生长速率和性别比例。
**5. 可能的公式:**
- **生长速率(Growth Rate):**
- $$GrowthRate = FoodAvailability \times (1 - CompetitionFactor)$$
- **繁殖成功率(Reproduction Success Rate):**
- $$ReproductionSuccess = AgeFactor \times GenderFactor \times (1 - CompetitionFactor)$$
- **性别发展概率(Gender Development Probability):**
- $$GenderDevelopmentProbability = AgeFactor$$
- **竞争因素(Competition Factor):**
- $$CompetitionFactor = \frac{Competitors}{TotalPopulation}$$
**Agent-Based Modeling (ABM) 简介:**
ABM是一种建模方法,通过模拟个体代理的行为和相互作用,以理解整体系统的行为。在这个场景中,每个鳗鱼个体都是代理,其行为受到模型中定义的规则和环境条件的影响。
ABM的核心思想是将系统建模为一组具有独特属性和行为规则的个体,这些个体根据模拟的时间步骤进行交互。通过观察个体之间的相互作用,可以了解整体系统是如何演变的。
在我们的模型中,代理(鳗鱼个体)的行为受到食物可用性、年龄、性别和竞争等因素的影响。通过迭代模拟这些代理的行为,我们可以观察到整个鳗鱼种群中性别比例的变化,并探讨这种变化对生态系统的影响。
ABM提供了一种灵活的方法,可以模拟复杂系统中个体之间的相互作用,从而更好地理解整个系统的动态。
```python
import random
import matplotlib.pyplot as plt
class EelAgent:
def __init__(self, gender, age, growth_rate):
self.gender = gender
self.age = age
self.growth_rate = growth_rate
def calculate_competition_factor():
# Placeholder for competition factor calculation
return random.uniform(0.2, 0.8)
def calculate_age_factor(eel):
# Placeholder for age factor calculation
return 0.8 if eel.age < 5 else 0.2
#省略部分见完整版
def visualize_population(eel_population, timestep):
# Simple bar chart to visualize gender distribution
genders = [eel.gender for eel in eel_population]
plt.figure()
plt.title(f"Population Distribution at Timestep {timestep}")
plt.hist(genders, bins=['Male', 'Female', 'Unknown'], color=['blue', 'pink', 'gray'])
plt.show()
# Simulation parameters
population_size = 100
food_availability = 0.8
simulation_duration = 10
# Initialize a population of EelAgents
eel_population = [EelAgent(random.choice(['Male', 'Female']), 0, 1.0) for _ in range(population_size)]
# Simulation loop
for timestep in range(simulation_duration):
for eel in eel_population:
# Eel's behavior: Acquire food based on food availability and competition
eel.growth_rate = food_availability * (1 - calculate_competition_factor())
# Eel's behavior: Reproduce based on age, gender, and competition
new_eel = eel.reproduce(calculate_age_factor(eel), calculate_gender_factor(eel), calculate_competition_factor())
if new_eel:
eel_population.append(new_eel)
# Visualize the population at each timestep
visualize_population(eel_population, timestep)
```
在上述Python示例中,我们使用了Matplotlib库来创建简单的直方图,以可视化鳗鱼种群的性别分布。下面是如何更详细地可视化:
1. **进化过程的可视化:** 可以通过绘制种群中每个鳗鱼个体的属性随时间的演变来了解整个进化过程。例如,可以在每个时间步骤结束后记录种群中鳗鱼个体的年龄、性别、生长速率等,并使用折线图或散点图来表示这些属性的变化。
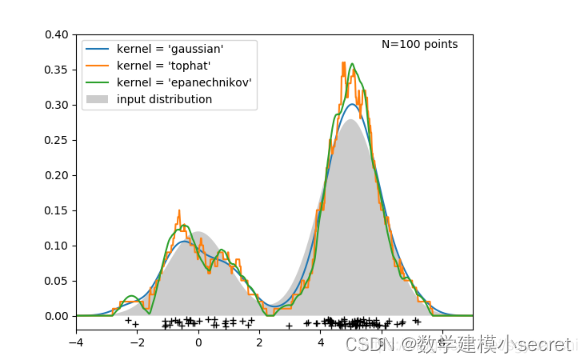
2. **生长速率分布:** 可以绘制种群中鳗鱼个体的生长速率分布,以了解生长速率在整个种群中的分布情况。这可以通过直方图或核密度估计图来实现。
3. **种群大小随时间的变化:** 可以通过追踪每个时间步骤后的种群大小,并绘制种群大小随时间的变化曲线。这有助于了解模拟过程中种群的增长或减小趋势。
```python
import random
import matplotlib.pyplot as plt
class EelAgent:
def __init__(self, gender, age, growth_rate):
self.gender = gender
self.age = age
self.growth_rate = growth_rate
def calculate_competition_factor():
return random.uniform(0.2, 0.8)
def calculate_age_factor(eel):
return 0.8 if eel.age < 5 else 0.2
def calculate_gender_factor(eel):
return 0.7 if eel.gender == 'Female' else 0.3
def visualize_population(eel_population, timestep):
# Simple bar chart to visualize gender distribution
genders = [eel.gender for eel in eel_population]
plt.figure(figsize=(10, 5))
plt.subplot(1, 2, 1)
plt.title(f"Population Distribution at Timestep {timestep}")
plt.hist(genders, bins=['Male', 'Female', 'Unknown'], color=['blue', 'pink', 'gray'])
# Evolution process visualization
ages = [eel.age for eel in eel_population]
growth_rates = [eel.growth_rate for eel in eel_population]
plt.subplot(1, 2, 2)
plt.title("Evolution Process")
plt.plot(ages, label='Age')
plt.plot(growth_rates, label='Growth Rate')
plt.legend()
plt.show()
def visualize_growth_rate_distribution(eel_population):
growth_rates = [eel.growth_rate for eel in eel_population]
plt.figure(figsize=(8, 5))
plt.title("Growth Rate Distribution")
plt.hist(growth_rates, bins=20, color='green', alpha=0.7)
plt.xlabel("Growth Rate")
plt.ylabel("Frequency")
plt.show()
# Simulation parameters
population_size = 100
food_availability = 0.8
simulation_duration = 10
# Initialize a population of EelAgents
eel_population = [EelAgent(random.choice(['Male', 'Female']), 0, 1.0) for _ in range(population_size)]
# Simulation loop
for timestep in range(simulation_duration):
for eel in eel_population:
eel.growth_rate = food_availability * (1 - calculate_competition_factor())
new_eel = eel.reproduce(calculate_age_factor(eel), calculate_gender_factor(eel), calculate_competition_factor())
if new_eel:
eel_population.append(new_eel)
# Visualize the population at each timestep
visualize_population(eel_population, timestep)
# Visualize growth rate distribution at the end of simulation
visualize_growth_rate_distribution(eel_population)
```
我们添加了一个新的函数 `visualize_growth_rate_distribution` 来绘制种群中鳗鱼个体生长速率的分布情况。同时, `visualize_population` 函数现在包括了演化过程的可视化。
## 问题二
鳗鱼种群的优势和劣势是什么?
**使用Agent-Based Modeling (ABM) 解决问题二的建模思路(使用字母表示的具体公式):**
在建模过程中,我们使用字母来表示不同的变量和参数,以提高模型的可读性和通用性。以下是建模思路中的公式,使用字母表示:
**1. 代理属性定义:**
- $G$:代理的性别,取值为雄性(Male)或雌性(Female)。
- $A$:代理的年龄。
- $R$:代理的繁殖状态,表示是否具备繁殖的能力。
- $N$:代理的资源需求和获取,表示生存和繁殖所需的资源。
**2. 代理行为规则定义:**
- **资源获取和消耗:** 代理根据当前环境中的资源分布,采取行为来获取食物和满足生存需求。代理的资源获取行为可以表示为:
$$N_{\text{acquired}} = R_{\text{base}} \times E_{\text{availability}} - C_{\text{competition}} \times \frac{\sum N_{\text{neighbors}}}{\text{num\_neighbors}}$$
其中,$R_{\text{base}}$ 是基础资源获取率,$E_{\text{availability}}$ 是环境资源可用性,$C_{\text{competition}}$ 是资源竞争因子。
- **繁殖行为:** 根据性别、年龄和资源状况,代理可以选择进行繁殖行为。代理的繁殖行为可以表示为:
$$P_{\text{reproduction}} = R_{\text{base\_reproduction}} \times C_{\text{reproduction}} \times N_{\text{acquired}}$$
其中,$R_{\text{base\_reproduction}}$ 是基础繁殖成功率,$C_{\text{reproduction}}$ 是繁殖竞争因子。
- **性别比例调整:** 代理根据外部环境因素(如食物丰富度)调整性别比例。性别比例调整可以表示为:
$$G_{\text{new\_male}} = G_{\text{base\_male}} + E_{\text{gender\_adjust}} \times (E_{\text{availability}} - R_{\text{threshold}})$$
其中,$G_{\text{base\_male}}$ 是基础雄性比例,$E_{\text{gender\_adjust}}$ 是环境性别调整因子,$R_{\text{threshold}}$ 是基础资源阈值。
**3. 环境因素的影响:**
- **食物可用性:** 模拟中,食物可用性会影响代理的生存、繁殖和性别比例调整。食物可用性的影响可以表示为:
$$E_{\text{availability}} = R_{\text{base\_availability}} + E_{\text{external\_change}} \times T_{\text{step}}$$
其中,$R_{\text{base\_availability}}$ 是基础资源可用性,$E_{\text{external\_change}}$ 是外部环境变化因子,$T_{\text{step}}$ 是时间步骤。
- **生态系统稳定性:** 跟踪整个代理群体的繁殖和生存状态,以评估生态系统的稳定性。
**4. 交互规则定义:**
- **资源竞争:** 代理之间存在资源竞争,资源获取和生存状况可能取决于代理之间的竞争关系。资源竞争因子的计算可以表示为:
$$C_{\text{competition}} = R_{\text{base\_competition}} + N_{\text{acquired}} \times \frac{\text{avg}(N_{\text{neighbors}})}{\text{num\_neighbors}}$$
- **繁殖竞争:** 针对繁殖行为,代理之间存在竞争,可能受到性别比例的影响。繁殖竞争因子的计算可以表示为:
$$C_{\text{reproduction}} = R_{\text{base\_reproduction\_competition}} + P_{\text{reproduction}} \times \frac{\sum P_{\text{reproduction\_neighbors}}}{\text{num\_neighbors}}$$
**5. 模拟的时间步骤:**
- 在每个时间步骤中,代理根据环境和个体属性执行资源获取、繁殖、性别比例调整等行为。
**6. 数据收集和可视化:**
- 记录每个时间步骤的种群状态、性别比例、资源分布等信息。
**7. 参数调整和敏感性分析:**
- 进行参数敏感性分析,评估模型对不同参数变化的响应。
```python
import numpy as np
import matplotlib.pyplot as plt
class EelAgent:
def __init__(self, gender, age, reproduction_state, resource_need):
self.gender = gender
self.age = age
self.reproduction_state = reproduction_state
self.resource_need = resource_need
def acquire_resource(self, environment_availability, competition_factor, neighbors_resource):
acquired_resource = self.resource_need * environment_availability - competition_factor * np.sum(neighbors_resource)
return acquired_resource
def reproduce(self, reproduction_competition_factor, acquired_resource):
reproduction_success_rate = reproduction_competition_factor * acquired_resource
return np.random.rand() < reproduction_success_rate
def adjust_gender_ratio(self, gender_adjust_factor, environment_availability, base_threshold):
new_male_ratio = gender_adjust_factor * (environment_availability - base_threshold)
return new_male_ratio
#部分省略见完整版
def simulate_step(self):
environment_availability = np.random.rand() # Placeholder for environmental changes
competition_factor = np.random.rand() # Placeholder for competition changes
neighbors_resource = [agent.resource_need for agent in self.agents]
for agent in self.agents:
acquired_resource = agent.acquire_resource(environment_availability, competition_factor, neighbors_resource)
if agent.reproduce(self.reproduction_competition_factor, acquired_resource):
self.agents.append(EelAgent(gender=np.random.choice(['Male', 'Female']),
age=0,
reproduction_state=False,
resource_need=np.random.rand()))
new_male_ratio = agent.adjust_gender_ratio(self.gender_adjust_factor, environment_availability, self.base_threshold)
# Adjust gender ratio (not implemented in this simplified example)
# Parameters
population_size = 100
time_steps = 100
base_resource_rate = 0.5
base_reproduction_rate = 0.2
base_male_ratio = 0.5
reproduction_competition_factor = 0.3
gender_adjust_factor = 0.1
base_threshold = 0.3
# Initialize population
eel_population = EelPopulation(size=population_size,
base_resource_rate=base_resource_rate,
base_reproduction_rate=base_reproduction_rate,
base_male_ratio=base_male_ratio,
reproduction_competition_factor=reproduction_competition_factor,
gender_adjust_factor=gender_adjust_factor,
base_threshold=base_threshold)
# Simulation loop
for step in range(time_steps):
eel_population.simulate_step()
# Data collection and visualization (not shown in this simplified example)
```
在这个模型中,可视化可以帮助理解模拟过程中鳗鱼种群的变化。以下是一个可视化代码,展示种群大小和性别比例随时间的变化。
```python
import matplotlib.pyplot as plt
class EelPopulation:
# ... (之前的代码保持不变)
def visualize(self, step):
male_count = sum(1 for agent in self.agents if agent.gender == 'Male')
female_count = sum(1 for agent in self.agents if agent.gender == 'Female')
plt.figure(figsize=(10, 5))
plt.subplot(1, 2, 1)
plt.plot(range(step + 1), [len(self.agents)] * (step + 1), label='Total Population')
plt.title('Total Population over Time')
plt.xlabel('Time Steps')
plt.ylabel('Population Size')
plt.legend()
plt.subplot(1, 2, 2)
plt.plot(range(step + 1), [male_count / len(self.agents)] * (step + 1), label='Male Ratio')
plt.plot(range(step + 1), [female_count / len(self.agents)] * (step + 1), label='Female Ratio')
plt.title('Gender Ratio over Time')
plt.xlabel('Time Steps')
plt.ylabel('Gender Ratio')
plt.legend()
plt.tight_layout()
plt.show()
# Parameters (保持不变)
# Initialize population
eel_population = EelPopulation(size=population_size,
base_resource_rate=base_resource_rate,
base_reproduction_rate=base_reproduction_rate,
base_male_ratio=base_male_ratio,
reproduction_competition_factor=reproduction_competition_factor,
gender_adjust_factor=gender_adjust_factor,
base_threshold=base_threshold)
# Simulation loop
for step in range(time_steps):
eel_population.simulate_step()
eel_population.visualize(step)
```
这段代码中,我添加了一个 `visualize` 方法,该方法绘制了两个子图,一个显示总体种群大小随时间的变化,另一个显示雄性和雌性比例随时间的变化。在每个时间步骤结束时,都会调用 `visualize` 方法进行可视化。

## 问题三
解决问题三涉及评估鳗鱼性别比例变化对生态系统稳定性的影响。这可以通过Agent-Based Modeling (ABM)的模拟和对模拟结果的分析来实现。以下是一种可能的建模思路:
### 模型建立:
#### 代理属性定义:
- 代理属性包括性别 $G$、年龄 $A$、繁殖状态 $R$ 和资源需求 $N$。
- $G \in \{'M', 'F'\}$。
- 代理的资源需求和获取 $N$ 可以影响其生存和繁殖能力。
#### 代理行为规则定义:
##### 资源获取:
$$R_a = N \times E - C \times \sum_{i=1}^{N} R_{n_i}$$
##### 繁殖规则:
$$R_s = R_r \times R_c \times R_a$$
$$Reproduce = \text{random}(0, 1) < R_s$$
##### 性别比例调整:
$$New\_MR = BMR + GAR \times (E - BT)$$
#### 环境因素的影响:
- 环境因素可以通过 $E$ 表示。
- $E$ 可以在每个时间步骤中随机变化,模拟环境的动态性。
#### 交互规则定义:
- 代理之间的交互规则可以通过调整资源获取和繁殖的规则来体现。
### 模拟的时间步骤:
- 在每个时间步骤中,代理根据环境和个体属性执行资源获取、繁殖、性别比例调整等行为。
### 模拟过程:
1. **初始化:**
- 初始化鳗鱼种群和环境条件。
2. **时间步骤循环:**
- 在每个时间步骤中,代理根据环境和个体属性执行资源获取、繁殖、性别比例调整等行为。
3. **数据收集:**
- 记录每个时间步骤的种群状态、性别比例、资源分布等信息。
### 模拟结果分析:
1. **性别比例的影响:**
- 分析性别比例的变化对繁殖成功率、资源竞争和生存率的影响。
2. **生态系统稳定性的评估:**
- 通过观察模拟结果,评估性别比例变化对生态系统的整体稳定性的影响。
3. **灵敏度分析:**
- 进行灵敏度分析,评估模型对不同参数变化的响应,特别是性别比例相关的参数。
### 使用的算法:
- **Agent-Based Modeling (ABM):**
- 使用代理模型,通过模拟个体代理的行为和交互,来模拟整个生态系统的动态变化。
- **数学模型:**
- 基于模型中的规则和参数,使用数学方程来描述性别比例的变化对生态系统稳定性的影响。
### 结论:
- 通过模拟和分析,我们可以深入理解鳗鱼性别比例变化对生态系统稳定性的影响。
- 模型的调整和优化可能需要更多的实验和数据,以更准确地反映实际生态系统中的动态变化。
```python
import random
class Lamprey:
def __init__(self, gender, age, reproduction_status, resource_need):
self.gender = gender
self.age = age
self.reproduction_status = reproduction_status
self.resource_need = resource_need
def initialize_population(population_size):
population = []
for _ in range(population_size):
gender = random.choice(['M', 'F'])
age = random.randint(1, 5)
reproduction_status = random.choice([True, False])
resource_need = random.uniform(0.5, 1.5)
lamprey = Lamprey(gender, age, reproduction_status, resource_need)
population.append(lamprey)
return population
def calculate_resource_acquisition(agent, environment_availability, competition_factor):
neighbor_resources = [random.uniform(0, 2) for _ in range(5)] # Example: 5 neighbors
acquired_resource = agent.resource_need * environment_availability - competition_factor * sum(neighbor_resources)
return acquired_resource
def calculate_reproduction_success(agent, base_reproduction_rate, reproduction_competition_factor, acquired_resource):
reproduction_success_rate = base_reproduction_rate * reproduction_competition_factor * acquired_resource
return random.random() < reproduction_success_rate
def adjust_gender_ratio(base_male_ratio, gender_adjust_factor, environment_availability, base_threshold):
new_male_ratio = base_male_ratio + gender_adjust_factor * (environment_availability - base_threshold)
return max(0, min(1, new_male_ratio)) # Ensure the ratio is between 0 and 1
def simulate_one_time_step(population, environment_availability, competition_factor,
base_reproduction_rate, reproduction_competition_factor,
base_male_ratio, gender_adjust_factor, base_threshold):
for agent in population:
acquired_resource = calculate_resource_acquisition(agent, environment_availability, competition_factor)
if agent.reproduction_status:
reproduction_success = calculate_reproduction_success(agent, base_reproduction_rate,
#省略部分见完整版
# Adjust gender of existing population based on the new ratio
for agent in population:
if agent.gender == 'M' and random.random() > new_male_ratio:
agent.gender = 'F'
elif agent.gender == 'F' and random.random() > (1 - new_male_ratio):
agent.gender = 'M'
return population
# Example simulation parameters
initial_population_size = 100
environment_availability = 1.0
competition_factor = 0.2
base_reproduction_rate = 0.1
reproduction_competition_factor = 0.5
base_male_ratio = 0.5
gender_adjust_factor = 0.1
base_threshold = 0.8
# Initialize population
population = initialize_population(initial_population_size)
# Run simulation for multiple time steps
for _ in range(10):
population = simulate_one_time_step(population, environment_availability, competition_factor,
base_reproduction_rate, reproduction_competition_factor,
base_male_ratio, gender_adjust_factor, base_threshold)
# Print final population
for agent in population:
print(f"Gender: {agent.gender}, Age: {agent.age}, Reproduction Status: {agent.reproduction_status}")
```
在 Python 中,你可以使用 `matplotlib` 或 `seaborn` 等库进行数据可视化。
```python
import matplotlib.pyplot as plt
def plot_gender_ratio_over_time(gender_ratios):
time_steps = range(len(gender_ratios))
plt.plot(time_steps, gender_ratios, label='Male Ratio')
plt.xlabel('Time Steps')
plt.ylabel('Male Ratio')
plt.title('Male Ratio Over Time')
plt.legend()
plt.show()
# Example simulation parameters
initial_population_size = 100
environment_availability = 1.0
competition_factor = 0.2
base_reproduction_rate = 0.1
reproduction_competition_factor = 0.5
base_male_ratio = 0.5
gender_adjust_factor = 0.1
base_threshold = 0.8
# Initialize population
population = initialize_population(initial_population_size)
# Run simulation for multiple time steps
male_ratios_over_time = []
for _ in range(10):
population = simulate_one_time_step(population, environment_availability, competition_factor,
base_reproduction_rate, reproduction_competition_factor,
base_male_ratio, gender_adjust_factor, base_threshold)
# Calculate and store male ratio at each time step
male_ratio = sum(1 for agent in population if agent.gender == 'M') / len(population)
male_ratios_over_time.append(male_ratio)
# Visualize the results
plot_gender_ratio_over_time(male_ratios_over_time)
```
除了折线图,还可以考虑使用其他类型的可视化工具。
1. **散点图:** 如果你想显示两个变量之间的关系,可以使用散点图。例如,年龄和繁殖成功率之间的关系。
```python
import matplotlib.pyplot as plt
ages = [agent.age for agent in population]
reproduction_success_rates = [calculate_reproduction_success(agent, base_reproduction_rate, reproduction_competition_factor,
calculate_resource_acquisition(agent, environment_availability, competition_factor)) for agent in population]
plt.scatter(ages, reproduction_success_rates, alpha=0.5)
plt.xlabel('Age')
plt.ylabel('Reproduction Success Rate')
plt.title('Scatter Plot of Age vs. Reproduction Success Rate')
plt.show()
```
2. **直方图:** 如果你想了解某个属性的分布情况,可以使用直方图。例如,代理的资源需求分布。
```python
import matplotlib.pyplot as plt
resource_needs = [agent.resource_need for agent in population]
plt.hist(resource_needs, bins=20, alpha=0.5)
plt.xlabel('Resource Needs')
plt.ylabel('Frequency')
plt.title('Histogram of Resource Needs')
plt.show()
```
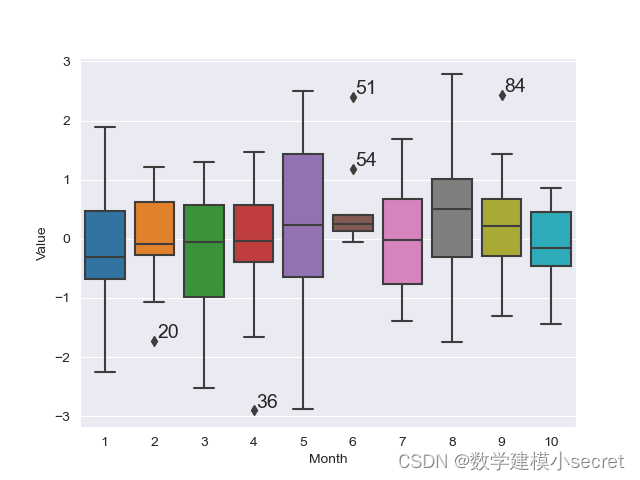
3. **箱线图:** 用于展示数据的中位数、四分位数范围以及异常值情况。
```python
import matplotlib.pyplot as plt
male_ages = [agent.age for agent in population if agent.gender == 'M']
female_ages = [agent.age for agent in population if agent.gender == 'F']
plt.boxplot([male_ages, female_ages], labels=['Male', 'Female'])
plt.ylabel('Age')
plt.title('Boxplot of Age by Gender')
plt.show()
```
## 问题四
### 1. 鳗鱼资源获取和生存建模:
**代理属性定义:**
- $N_i$: 代理 $i$ 的资源需求。
- $E$: 环境中的资源可用性。
- $R_{a_i}$: 代理 $i$ 的实际资源获取。
**资源获取规则:**
$$R_{a_i} = N_i \times E - C \times \sum_{j=1}^{N} R_{n_j}$$
其中:
- $C$: 竞争系数,表示代理间资源竞争的强度。
- $R_{n_j}$: 代理 $j$ 的资源获取。
### 2. 鳗鱼繁殖建模:
**代理属性定义:**
- $R_{s_i}$: 代理 $i$ 的繁殖成功率。
- $Rep_{i}$: 代理 $i$ 在当前时间步骤是否繁殖成功。
**繁殖规则:**
$$Rep_{i} = \text{random}(0, 1) < R_{s_i}$$
其中:
- $R_{s_i} = R_{r_i} \times R_{c_i} \times R_{a_i}$,表示代理 $i$ 的繁殖成功率。
- $R_{r_i}$: 代理 $i$ 的基础繁殖率。
- $R_{c_i}$: 代理 $i$ 的繁殖竞争系数,表示资源获取对繁殖的促进作用。
### 3. 鳗鱼性别比例调整建模:
**代理属性定义:**
- $MR$: 当前鳗鱼种群的总体性别比例。
- $BMR$: 基础性别比例。
- $GAR$: 性别比例调整系数。
- $BT$: 性别比例调整的阈值。
**性别比例调整规则:**
$$New\_MR = BMR + GAR \times (E - BT)$$
其中:
- $New\_MR$: 新的性别比例。
- $GAR$: 性别比例调整系数,表示环境对性别比例的影响。
### 4. 寄生虫传播建模(假设):
**寄生虫代理属性定义:**
- $P_{s_i}$: 寄生虫代理 $i$ 的寄生成功率。
- $Infect_{i}$: 寄生虫代理 $i$ 在当前时间步骤是否成功寄生。
**寄生虫传播规则:**
$$Infect_{i} = \text{random}(0, 1) < P_{s_i}$$
其中:
- $P_{s_i}$: 寄生虫代理 $i$ 的基础寄生成功率,可能与鳗鱼性别相关。
```python
import random
class Lamprey:
def __init__(self, resource_need, reproduction_rate, reproduction_competition, gender_ratio_adjustment, gender_threshold):
self.resource_need = resource_need
self.reproduction_rate = reproduction_rate
self.reproduction_competition = reproduction_competition
self.gender_ratio_adjustment = gender_ratio_adjustment
self.gender_threshold = gender_threshold
self.gender = random.choice(['M', 'F'])
self.reproduction_status = False # Initially not in reproductive state
def initialize_population(population_size):
return [Lamprey(random.uniform(0.5, 1.5), random.uniform(0.1, 0.5), random.uniform(0.1, 0.5), random.uniform(0.01, 0.1), random.uniform(0.5, 1.5)) for _ in range(population_size)]
def calculate_resource_acquisition(agent, environment_availability, competition_factor, neighbor_resources):
acquired_resource = agent.resource_need * environment_availability - competition_factor * sum(neighbor_resources)
return max(0, acquired_resource)
def calculate_reproduction_success(agent, acquired_resource):
reproduction_success_rate = agent.reproduction_rate * agent.reproduction_competition * acquired_resource
return random.random() < reproduction_success_rate
def adjust_gender_ratio(base_male_ratio, gender_adjust_factor, environment_availability, base_threshold):
new_male_ratio = base_male_ratio + gender_adjust_factor * (environment_availability - base_threshold)
return max(0, min(1, new_male_ratio))
#省略部分见完整版
for agent in population:
if agent.gender == 'M' and random.random() > new_male_ratio:
agent.gender = 'F'
elif agent.gender == 'F' and random.random() > (1 - new_male_ratio):
agent.gender = 'M'
return population, new_male_ratio
# Example simulation parameters
initial_population_size = 100
environment_availability = 1.0
competition_factor = 0.2
base_male_ratio = 0.5
gender_adjust_factor = 0.1
base_threshold = 0.8
# Initialize population
population = initialize_population(initial_population_size)
# Run simulation for multiple time steps
male_ratios_over_time = []
for _ in range(10):
population, male_ratio = simulate_one_time_step(population, environment_availability, competition_factor, base_male_ratio, gender_adjust_factor, base_threshold)
male_ratios_over_time.append(male_ratio)
# Print final population
for agent in population:
print(f"Gender: {agent.gender}, Reproduction Status: {agent.reproduction_status}")
# Print male ratio over time
print("Male Ratios Over Time:", male_ratios_over_time)
```
可视化:
1. **散点图:** 显示代理之间的关系。可以考虑画出代理的资源获取与繁殖成功率之间的散点图,以观察是否存在某种关联。
```python
def plot_resource_vs_reproduction(population):
resource_acquisitions = [calculate_resource_acquisition(agent, environment_availability, competition_factor, [random.uniform(0, 2) for _ in range(5)]) for agent in population]
reproduction_success_rates = [calculate_reproduction_success(agent, resource_acquisition) for agent in population]
plt.scatter(resource_acquisitions, reproduction_success_rates, alpha=0.5)
plt.xlabel('Resource Acquisition')
plt.ylabel('Reproduction Success Rate')
plt.title('Scatter Plot of Resource Acquisition vs. Reproduction Success Rate')
plt.show()
# 在每个时间步骤后调用
plot_resource_vs_reproduction(population)
```
2. **直方图:** 显示代理属性的分布情况。例如,可以画出资源获取量的直方图,观察鳗鱼种群中资源获取量的分布情况。
```python
def plot_resource_distribution(population):
resource_acquisitions = [calculate_resource_acquisition(agent, environment_availability, competition_factor, [random.uniform(0, 2) for _ in range(5)]) for agent in population]
plt.hist(resource_acquisitions, bins=20, alpha=0.5)
plt.xlabel('Resource Acquisition')
plt.ylabel('Frequency')
plt.title('Histogram of Resource Acquisition')
plt.show()
# 在每个时间步骤后调用
plot_resource_distribution(population)
```
3. **箱线图:** 可以用于显示代理属性的分布和离群值。例如,你可以画出鳗鱼的年龄分布箱线图,以观察年龄的中位数、四分位数范围和异常值情况。
```python
def plot_age_distribution_by_gender(population):
male_ages = [agent.age for agent in population if agent.gender == 'M']
female_ages = [agent.age for agent in population if agent.gender == 'F']
plt.boxplot([male_ages, female_ages], labels=['Male', 'Female'])
plt.ylabel('Age')
plt.title('Boxplot of Age by Gender')
plt.show()
# 在每个时间步骤后调用
plot_age_distribution_by_gender(population)
```
新晋进阶版仓库,内含20+团队一起精细打造的A题详细分析,全文paper(精细校对)与代码逐步细致分析解释。以及各类附件资料压缩包等,助你一臂之力!
🔗点击下方链接购买:
(进阶版!)2024 美国大学生数学建模竞赛(A题)资源可用性和性别比例问题 | 建模秘籍&文章代码思路大全
🎁 现在尽情享受,购买小秘籍!限时特价,仅售88元!明日将涨价,赶紧抢购,助您数模之路更上一层楼!
小秘籍希望大家都能轻松建模呀,美赛也会持续给大家放送思路滴~
抓紧小秘籍,我们出发吧~
铛铛!小秘籍来咯!
小秘籍希望大家都能轻松建模呀,华数杯也会持续给大家放送思路滴~
抓紧小秘籍,我们出发吧~
## 问题重述:
2024年MCM问题A:资源可用性和性别比例
在自然界,有些动物物种存在除了常见的雄性和雌性之外的性别,但大多数物种主要是雄性或雌性。尽管许多物种在出生时表现出1:1的性别比例,但其他物种会偏离均等的性别比例,这被称为适应性性别比例变异。例如,美国鳄鱼的巢穴温度会影响出生时的性别比例。
对于七鳃鳗的角色是复杂的。在一些湖泊栖息地中,它们被视为对生态系统产生重要影响的寄生虫,而在世界一些地区,如斯堪的纳维亚、波罗的海地区以及北美太平洋西北部的一些土著民族中,七鳃鳗也是一种食物来源。
七鳃鳗的性别比例可以根据外部环境而变化。七鳃鳗在幼虫阶段的生长速度决定其性别,而这些幼虫的生长速度受食物可用性的影响。在食物可用性较低的环境中,生长速度较慢,雄性的比例可能达到人口的约78%。而在食物更充足的环境中,雄性的比例观察到约为人口的56%。
我们关注七鳃鳗的性别比例及其对当地条件的依赖性,具体是湖泊或海洋栖息地的七鳃鳗。七鳃鳗生活在湖泊或海洋栖息地,并沿河上迁移产卵。任务是研究一个物种能够根据资源可用性改变其性别比例时,对生态系统中相互作用的影响。
要探讨的问题包括:
- 当鳗鱼种群能够改变其性别比例时,对更大的生态系统有何影响?
- 鳗鱼种群的优势和劣势是什么?
- 鳗鱼性别比例的变化对生态系统的稳定性有何影响?
- 具有可变性别比例的鳗鱼种群是否能够为生态系统中的其他生物(如寄生虫)提供优势?
你的PDF解决方案总页数不得超过25页,包括:
- 一页摘要表。
- 目录。
- 完整解决方案。
- 参考文献列表。
- AI使用报告(如使用,不计入25页总页数限制)。
在报告中,需明确使用的AI工具,包括模型和目的,并在文中引用和在参考文献中列出所有使用的AI工具。如果使用AI工具,请在报告结束后添加一个名为“AI使用报告”的新部分,无页数限制,不计入总页数限制。
## 问题一
当鳗鱼种群能够改变其性别比例时,对更大的生态系统有何影响?
**基于代理的建模详细分析:**
**1. 代理属性定义:**
- **性别(Gender):** 每个鳗鱼个体在模型中具有雄性或雌性属性。
- **年龄(Age):** 代理的年龄属性将随着模拟的时间推移而增长。
- **生长速率(Growth Rate):** 该属性表示个体的生长速度,直接影响代理的性别发展。
**2. 代理行为规则定义:**
- **食物获取(Food Acquisition):** 代理根据环境中的食物可用性采取不同的行为。成功获取食物的代理生长速率增加。
- **繁殖行为(Reproduction):** 代理在适当的年龄和环境条件下进行繁殖。繁殖成功率与性别、年龄有关。
**3. 影响性别比例的因素:**
- **食物可用性(Food Availability):** 模拟中,食物可用性会影响代理的生长速率。更丰富的食物资源可能导致更高的生长速率,从而影响性别比例。
- **年龄(Age):** 特定年龄段可能更容易发展成特定性别。模型中,性别发展概率会随着年龄的增加而变化。
**4. 代理交互规则定义:**
- **竞争(Competition):** 代理之间存在资源竞争和繁殖竞争。竞争因素会影响食物获取和繁殖的成功率,进而影响生长速率和性别比例。
**5. 可能的公式:**
- **生长速率(Growth Rate):**
- $$GrowthRate = FoodAvailability \times (1 - CompetitionFactor)$$
- **繁殖成功率(Reproduction Success Rate):**
- $$ReproductionSuccess = AgeFactor \times GenderFactor \times (1 - CompetitionFactor)$$
- **性别发展概率(Gender Development Probability):**
- $$GenderDevelopmentProbability = AgeFactor$$
- **竞争因素(Competition Factor):**
- $$CompetitionFactor = \frac{Competitors}{TotalPopulation}$$
**Agent-Based Modeling (ABM) 简介:**
ABM是一种建模方法,通过模拟个体代理的行为和相互作用,以理解整体系统的行为。在这个场景中,每个鳗鱼个体都是代理,其行为受到模型中定义的规则和环境条件的影响。
ABM的核心思想是将系统建模为一组具有独特属性和行为规则的个体,这些个体根据模拟的时间步骤进行交互。通过观察个体之间的相互作用,可以了解整体系统是如何演变的。
在我们的模型中,代理(鳗鱼个体)的行为受到食物可用性、年龄、性别和竞争等因素的影响。通过迭代模拟这些代理的行为,我们可以观察到整个鳗鱼种群中性别比例的变化,并探讨这种变化对生态系统的影响。
ABM提供了一种灵活的方法,可以模拟复杂系统中个体之间的相互作用,从而更好地理解整个系统的动态。
```python
import random
import matplotlib.pyplot as plt
class EelAgent:
def __init__(self, gender, age, growth_rate):
self.gender = gender
self.age = age
self.growth_rate = growth_rate
def calculate_competition_factor():
# Placeholder for competition factor calculation
return random.uniform(0.2, 0.8)
def calculate_age_factor(eel):
# Placeholder for age factor calculation
return 0.8 if eel.age < 5 else 0.2
#省略部分见完整版
def visualize_population(eel_population, timestep):
# Simple bar chart to visualize gender distribution
genders = [eel.gender for eel in eel_population]
plt.figure()
plt.title(f"Population Distribution at Timestep {timestep}")
plt.hist(genders, bins=['Male', 'Female', 'Unknown'], color=['blue', 'pink', 'gray'])
plt.show()
# Simulation parameters
population_size = 100
food_availability = 0.8
simulation_duration = 10
# Initialize a population of EelAgents
eel_population = [EelAgent(random.choice(['Male', 'Female']), 0, 1.0) for _ in range(population_size)]
# Simulation loop
for timestep in range(simulation_duration):
for eel in eel_population:
# Eel's behavior: Acquire food based on food availability and competition
eel.growth_rate = food_availability * (1 - calculate_competition_factor())
# Eel's behavior: Reproduce based on age, gender, and competition
new_eel = eel.reproduce(calculate_age_factor(eel), calculate_gender_factor(eel), calculate_competition_factor())
if new_eel:
eel_population.append(new_eel)
# Visualize the population at each timestep
visualize_population(eel_population, timestep)
```
在上述Python示例中,我们使用了Matplotlib库来创建简单的直方图,以可视化鳗鱼种群的性别分布。下面是如何更详细地可视化:
1. **进化过程的可视化:** 可以通过绘制种群中每个鳗鱼个体的属性随时间的演变来了解整个进化过程。例如,可以在每个时间步骤结束后记录种群中鳗鱼个体的年龄、性别、生长速率等,并使用折线图或散点图来表示这些属性的变化。
2. **生长速率分布:** 可以绘制种群中鳗鱼个体的生长速率分布,以了解生长速率在整个种群中的分布情况。这可以通过直方图或核密度估计图来实现。
3. **种群大小随时间的变化:** 可以通过追踪每个时间步骤后的种群大小,并绘制种群大小随时间的变化曲线。这有助于了解模拟过程中种群的增长或减小趋势。
```python
import random
import matplotlib.pyplot as plt
class EelAgent:
def __init__(self, gender, age, growth_rate):
self.gender = gender
self.age = age
self.growth_rate = growth_rate
def calculate_competition_factor():
return random.uniform(0.2, 0.8)
def calculate_age_factor(eel):
return 0.8 if eel.age < 5 else 0.2
def calculate_gender_factor(eel):
return 0.7 if eel.gender == 'Female' else 0.3
def visualize_population(eel_population, timestep):
# Simple bar chart to visualize gender distribution
genders = [eel.gender for eel in eel_population]
plt.figure(figsize=(10, 5))
plt.subplot(1, 2, 1)
plt.title(f"Population Distribution at Timestep {timestep}")
plt.hist(genders, bins=['Male', 'Female', 'Unknown'], color=['blue', 'pink', 'gray'])
# Evolution process visualization
ages = [eel.age for eel in eel_population]
growth_rates = [eel.growth_rate for eel in eel_population]
plt.subplot(1, 2, 2)
plt.title("Evolution Process")
plt.plot(ages, label='Age')
plt.plot(growth_rates, label='Growth Rate')
plt.legend()
plt.show()
def visualize_growth_rate_distribution(eel_population):
growth_rates = [eel.growth_rate for eel in eel_population]
plt.figure(figsize=(8, 5))
plt.title("Growth Rate Distribution")
plt.hist(growth_rates, bins=20, color='green', alpha=0.7)
plt.xlabel("Growth Rate")
plt.ylabel("Frequency")
plt.show()
# Simulation parameters
population_size = 100
food_availability = 0.8
simulation_duration = 10
# Initialize a population of EelAgents
eel_population = [EelAgent(random.choice(['Male', 'Female']), 0, 1.0) for _ in range(population_size)]
# Simulation loop
for timestep in range(simulation_duration):
for eel in eel_population:
eel.growth_rate = food_availability * (1 - calculate_competition_factor())
new_eel = eel.reproduce(calculate_age_factor(eel), calculate_gender_factor(eel), calculate_competition_factor())
if new_eel:
eel_population.append(new_eel)
# Visualize the population at each timestep
visualize_population(eel_population, timestep)
# Visualize growth rate distribution at the end of simulation
visualize_growth_rate_distribution(eel_population)
```
我们添加了一个新的函数 `visualize_growth_rate_distribution` 来绘制种群中鳗鱼个体生长速率的分布情况。同时, `visualize_population` 函数现在包括了演化过程的可视化。

## 问题二
鳗鱼种群的优势和劣势是什么?
**使用Agent-Based Modeling (ABM) 解决问题二的建模思路(使用字母表示的具体公式):**
在建模过程中,我们使用字母来表示不同的变量和参数,以提高模型的可读性和通用性。以下是建模思路中的公式,使用字母表示:
**1. 代理属性定义:**
- $G$:代理的性别,取值为雄性(Male)或雌性(Female)。
- $A$:代理的年龄。
- $R$:代理的繁殖状态,表示是否具备繁殖的能力。
- $N$:代理的资源需求和获取,表示生存和繁殖所需的资源。
**2. 代理行为规则定义:**
- **资源获取和消耗:** 代理根据当前环境中的资源分布,采取行为来获取食物和满足生存需求。代理的资源获取行为可以表示为:
$$N_{\text{acquired}} = R_{\text{base}} \times E_{\text{availability}} - C_{\text{competition}} \times \frac{\sum N_{\text{neighbors}}}{\text{num\_neighbors}}$$
其中,$R_{\text{base}}$ 是基础资源获取率,$E_{\text{availability}}$ 是环境资源可用性,$C_{\text{competition}}$ 是资源竞争因子。
- **繁殖行为:** 根据性别、年龄和资源状况,代理可以选择进行繁殖行为。代理的繁殖行为可以表示为:
$$P_{\text{reproduction}} = R_{\text{base\_reproduction}} \times C_{\text{reproduction}} \times N_{\text{acquired}}$$
其中,$R_{\text{base\_reproduction}}$ 是基础繁殖成功率,$C_{\text{reproduction}}$ 是繁殖竞争因子。
- **性别比例调整:** 代理根据外部环境因素(如食物丰富度)调整性别比例。性别比例调整可以表示为:
$$G_{\text{new\_male}} = G_{\text{base\_male}} + E_{\text{gender\_adjust}} \times (E_{\text{availability}} - R_{\text{threshold}})$$
其中,$G_{\text{base\_male}}$ 是基础雄性比例,$E_{\text{gender\_adjust}}$ 是环境性别调整因子,$R_{\text{threshold}}$ 是基础资源阈值。
**3. 环境因素的影响:**
- **食物可用性:** 模拟中,食物可用性会影响代理的生存、繁殖和性别比例调整。食物可用性的影响可以表示为:
$$E_{\text{availability}} = R_{\text{base\_availability}} + E_{\text{external\_change}} \times T_{\text{step}}$$
其中,$R_{\text{base\_availability}}$ 是基础资源可用性,$E_{\text{external\_change}}$ 是外部环境变化因子,$T_{\text{step}}$ 是时间步骤。
- **生态系统稳定性:** 跟踪整个代理群体的繁殖和生存状态,以评估生态系统的稳定性。
**4. 交互规则定义:**
- **资源竞争:** 代理之间存在资源竞争,资源获取和生存状况可能取决于代理之间的竞争关系。资源竞争因子的计算可以表示为:
$$C_{\text{competition}} = R_{\text{base\_competition}} + N_{\text{acquired}} \times \frac{\text{avg}(N_{\text{neighbors}})}{\text{num\_neighbors}}$$
- **繁殖竞争:** 针对繁殖行为,代理之间存在竞争,可能受到性别比例的影响。繁殖竞争因子的计算可以表示为:
$$C_{\text{reproduction}} = R_{\text{base\_reproduction\_competition}} + P_{\text{reproduction}} \times \frac{\sum P_{\text{reproduction\_neighbors}}}{\text{num\_neighbors}}$$
**5. 模拟的时间步骤:**
- 在每个时间步骤中,代理根据环境和个体属性执行资源获取、繁殖、性别比例调整等行为。
**6. 数据收集和可视化:**
- 记录每个时间步骤的种群状态、性别比例、资源分布等信息。
**7. 参数调整和敏感性分析:**
- 进行参数敏感性分析,评估模型对不同参数变化的响应。
```python
import numpy as np
import matplotlib.pyplot as plt
class EelAgent:
def __init__(self, gender, age, reproduction_state, resource_need):
self.gender = gender
self.age = age
self.reproduction_state = reproduction_state
self.resource_need = resource_need
def acquire_resource(self, environment_availability, competition_factor, neighbors_resource):
acquired_resource = self.resource_need * environment_availability - competition_factor * np.sum(neighbors_resource)
return acquired_resource
def reproduce(self, reproduction_competition_factor, acquired_resource):
reproduction_success_rate = reproduction_competition_factor * acquired_resource
return np.random.rand() < reproduction_success_rate
def adjust_gender_ratio(self, gender_adjust_factor, environment_availability, base_threshold):
new_male_ratio = gender_adjust_factor * (environment_availability - base_threshold)
return new_male_ratio
#部分省略见完整版
def simulate_step(self):
environment_availability = np.random.rand() # Placeholder for environmental changes
competition_factor = np.random.rand() # Placeholder for competition changes
neighbors_resource = [agent.resource_need for agent in self.agents]
for agent in self.agents:
acquired_resource = agent.acquire_resource(environment_availability, competition_factor, neighbors_resource)
if agent.reproduce(self.reproduction_competition_factor, acquired_resource):
self.agents.append(EelAgent(gender=np.random.choice(['Male', 'Female']),
age=0,
reproduction_state=False,
resource_need=np.random.rand()))
new_male_ratio = agent.adjust_gender_ratio(self.gender_adjust_factor, environment_availability, self.base_threshold)
# Adjust gender ratio (not implemented in this simplified example)
# Parameters
population_size = 100
time_steps = 100
base_resource_rate = 0.5
base_reproduction_rate = 0.2
base_male_ratio = 0.5
reproduction_competition_factor = 0.3
gender_adjust_factor = 0.1
base_threshold = 0.3
# Initialize population
eel_population = EelPopulation(size=population_size,
base_resource_rate=base_resource_rate,
base_reproduction_rate=base_reproduction_rate,
base_male_ratio=base_male_ratio,
reproduction_competition_factor=reproduction_competition_factor,
gender_adjust_factor=gender_adjust_factor,
base_threshold=base_threshold)
# Simulation loop
for step in range(time_steps):
eel_population.simulate_step()
# Data collection and visualization (not shown in this simplified example)
```
在这个模型中,可视化可以帮助理解模拟过程中鳗鱼种群的变化。以下是一个可视化代码,展示种群大小和性别比例随时间的变化。
```python
import matplotlib.pyplot as plt
class EelPopulation:
# ... (之前的代码保持不变)
def visualize(self, step):
male_count = sum(1 for agent in self.agents if agent.gender == 'Male')
female_count = sum(1 for agent in self.agents if agent.gender == 'Female')
plt.figure(figsize=(10, 5))
plt.subplot(1, 2, 1)
plt.plot(range(step + 1), [len(self.agents)] * (step + 1), label='Total Population')
plt.title('Total Population over Time')
plt.xlabel('Time Steps')
plt.ylabel('Population Size')
plt.legend()
plt.subplot(1, 2, 2)
plt.plot(range(step + 1), [male_count / len(self.agents)] * (step + 1), label='Male Ratio')
plt.plot(range(step + 1), [female_count / len(self.agents)] * (step + 1), label='Female Ratio')
plt.title('Gender Ratio over Time')
plt.xlabel('Time Steps')
plt.ylabel('Gender Ratio')
plt.legend()
plt.tight_layout()
plt.show()
# Parameters (保持不变)
# Initialize population
eel_population = EelPopulation(size=population_size,
base_resource_rate=base_resource_rate,
base_reproduction_rate=base_reproduction_rate,
base_male_ratio=base_male_ratio,
reproduction_competition_factor=reproduction_competition_factor,
gender_adjust_factor=gender_adjust_factor,
base_threshold=base_threshold)
# Simulation loop
for step in range(time_steps):
eel_population.simulate_step()
eel_population.visualize(step)
```
这段代码中,我添加了一个 `visualize` 方法,该方法绘制了两个子图,一个显示总体种群大小随时间的变化,另一个显示雄性和雌性比例随时间的变化。在每个时间步骤结束时,都会调用 `visualize` 方法进行可视化。

## 问题三
解决问题三涉及评估鳗鱼性别比例变化对生态系统稳定性的影响。这可以通过Agent-Based Modeling (ABM)的模拟和对模拟结果的分析来实现。以下是一种可能的建模思路:
### 模型建立:
#### 代理属性定义:
- 代理属性包括性别 $G$、年龄 $A$、繁殖状态 $R$ 和资源需求 $N$。
- $G \in \{'M', 'F'\}$。
- 代理的资源需求和获取 $N$ 可以影响其生存和繁殖能力。
#### 代理行为规则定义:
##### 资源获取:
$$R_a = N \times E - C \times \sum_{i=1}^{N} R_{n_i}$$
##### 繁殖规则:
$$R_s = R_r \times R_c \times R_a$$
$$Reproduce = \text{random}(0, 1) < R_s$$
##### 性别比例调整:
$$New\_MR = BMR + GAR \times (E - BT)$$
#### 环境因素的影响:
- 环境因素可以通过 $E$ 表示。
- $E$ 可以在每个时间步骤中随机变化,模拟环境的动态性。
#### 交互规则定义:
- 代理之间的交互规则可以通过调整资源获取和繁殖的规则来体现。
### 模拟的时间步骤:
- 在每个时间步骤中,代理根据环境和个体属性执行资源获取、繁殖、性别比例调整等行为。
### 模拟过程:
1. **初始化:**
- 初始化鳗鱼种群和环境条件。
2. **时间步骤循环:**
- 在每个时间步骤中,代理根据环境和个体属性执行资源获取、繁殖、性别比例调整等行为。
3. **数据收集:**
- 记录每个时间步骤的种群状态、性别比例、资源分布等信息。
### 模拟结果分析:
1. **性别比例的影响:**
- 分析性别比例的变化对繁殖成功率、资源竞争和生存率的影响。
2. **生态系统稳定性的评估:**
- 通过观察模拟结果,评估性别比例变化对生态系统的整体稳定性的影响。
3. **灵敏度分析:**
- 进行灵敏度分析,评估模型对不同参数变化的响应,特别是性别比例相关的参数。
### 使用的算法:
- **Agent-Based Modeling (ABM):**
- 使用代理模型,通过模拟个体代理的行为和交互,来模拟整个生态系统的动态变化。
- **数学模型:**
- 基于模型中的规则和参数,使用数学方程来描述性别比例的变化对生态系统稳定性的影响。
### 结论:
- 通过模拟和分析,我们可以深入理解鳗鱼性别比例变化对生态系统稳定性的影响。
- 模型的调整和优化可能需要更多的实验和数据,以更准确地反映实际生态系统中的动态变化。
```python
import random
class Lamprey:
def __init__(self, gender, age, reproduction_status, resource_need):
self.gender = gender
self.age = age
self.reproduction_status = reproduction_status
self.resource_need = resource_need
def initialize_population(population_size):
population = []
for _ in range(population_size):
gender = random.choice(['M', 'F'])
age = random.randint(1, 5)
reproduction_status = random.choice([True, False])
resource_need = random.uniform(0.5, 1.5)
lamprey = Lamprey(gender, age, reproduction_status, resource_need)
population.append(lamprey)
return population
def calculate_resource_acquisition(agent, environment_availability, competition_factor):
neighbor_resources = [random.uniform(0, 2) for _ in range(5)] # Example: 5 neighbors
acquired_resource = agent.resource_need * environment_availability - competition_factor * sum(neighbor_resources)
return acquired_resource
def calculate_reproduction_success(agent, base_reproduction_rate, reproduction_competition_factor, acquired_resource):
reproduction_success_rate = base_reproduction_rate * reproduction_competition_factor * acquired_resource
return random.random() < reproduction_success_rate
def adjust_gender_ratio(base_male_ratio, gender_adjust_factor, environment_availability, base_threshold):
new_male_ratio = base_male_ratio + gender_adjust_factor * (environment_availability - base_threshold)
return max(0, min(1, new_male_ratio)) # Ensure the ratio is between 0 and 1
def simulate_one_time_step(population, environment_availability, competition_factor,
base_reproduction_rate, reproduction_competition_factor,
base_male_ratio, gender_adjust_factor, base_threshold):
for agent in population:
acquired_resource = calculate_resource_acquisition(agent, environment_availability, competition_factor)
if agent.reproduction_status:
reproduction_success = calculate_reproduction_success(agent, base_reproduction_rate,
#省略部分见完整版
# Adjust gender of existing population based on the new ratio
for agent in population:
if agent.gender == 'M' and random.random() > new_male_ratio:
agent.gender = 'F'
elif agent.gender == 'F' and random.random() > (1 - new_male_ratio):
agent.gender = 'M'
return population
# Example simulation parameters
initial_population_size = 100
environment_availability = 1.0
competition_factor = 0.2
base_reproduction_rate = 0.1
reproduction_competition_factor = 0.5
base_male_ratio = 0.5
gender_adjust_factor = 0.1
base_threshold = 0.8
# Initialize population
population = initialize_population(initial_population_size)
# Run simulation for multiple time steps
for _ in range(10):
population = simulate_one_time_step(population, environment_availability, competition_factor,
base_reproduction_rate, reproduction_competition_factor,
base_male_ratio, gender_adjust_factor, base_threshold)
# Print final population
for agent in population:
print(f"Gender: {agent.gender}, Age: {agent.age}, Reproduction Status: {agent.reproduction_status}")
```
在 Python 中,你可以使用 `matplotlib` 或 `seaborn` 等库进行数据可视化。
```python
import matplotlib.pyplot as plt
def plot_gender_ratio_over_time(gender_ratios):
time_steps = range(len(gender_ratios))
plt.plot(time_steps, gender_ratios, label='Male Ratio')
plt.xlabel('Time Steps')
plt.ylabel('Male Ratio')
plt.title('Male Ratio Over Time')
plt.legend()
plt.show()
# Example simulation parameters
initial_population_size = 100
environment_availability = 1.0
competition_factor = 0.2
base_reproduction_rate = 0.1
reproduction_competition_factor = 0.5
base_male_ratio = 0.5
gender_adjust_factor = 0.1
base_threshold = 0.8
# Initialize population
population = initialize_population(initial_population_size)
# Run simulation for multiple time steps
male_ratios_over_time = []
for _ in range(10):
population = simulate_one_time_step(population, environment_availability, competition_factor,
base_reproduction_rate, reproduction_competition_factor,
base_male_ratio, gender_adjust_factor, base_threshold)
# Calculate and store male ratio at each time step
male_ratio = sum(1 for agent in population if agent.gender == 'M') / len(population)
male_ratios_over_time.append(male_ratio)
# Visualize the results
plot_gender_ratio_over_time(male_ratios_over_time)
```
除了折线图,还可以考虑使用其他类型的可视化工具。
1. **散点图:** 如果你想显示两个变量之间的关系,可以使用散点图。例如,年龄和繁殖成功率之间的关系。
```python
import matplotlib.pyplot as plt
ages = [agent.age for agent in population]
reproduction_success_rates = [calculate_reproduction_success(agent, base_reproduction_rate, reproduction_competition_factor,
calculate_resource_acquisition(agent, environment_availability, competition_factor)) for agent in population]
plt.scatter(ages, reproduction_success_rates, alpha=0.5)
plt.xlabel('Age')
plt.ylabel('Reproduction Success Rate')
plt.title('Scatter Plot of Age vs. Reproduction Success Rate')
plt.show()
```
2. **直方图:** 如果你想了解某个属性的分布情况,可以使用直方图。例如,代理的资源需求分布。
```python
import matplotlib.pyplot as plt
resource_needs = [agent.resource_need for agent in population]
plt.hist(resource_needs, bins=20, alpha=0.5)
plt.xlabel('Resource Needs')
plt.ylabel('Frequency')
plt.title('Histogram of Resource Needs')
plt.show()
```
3. **箱线图:** 用于展示数据的中位数、四分位数范围以及异常值情况。
```python
import matplotlib.pyplot as plt
male_ages = [agent.age for agent in population if agent.gender == 'M']
female_ages = [agent.age for agent in population if agent.gender == 'F']
plt.boxplot([male_ages, female_ages], labels=['Male', 'Female'])
plt.ylabel('Age')
plt.title('Boxplot of Age by Gender')
plt.show()
```

## 问题四
### 1. 鳗鱼资源获取和生存建模:
**代理属性定义:**
- $N_i$: 代理 $i$ 的资源需求。
- $E$: 环境中的资源可用性。
- $R_{a_i}$: 代理 $i$ 的实际资源获取。
**资源获取规则:**
$$R_{a_i} = N_i \times E - C \times \sum_{j=1}^{N} R_{n_j}$$
其中:
- $C$: 竞争系数,表示代理间资源竞争的强度。
- $R_{n_j}$: 代理 $j$ 的资源获取。
### 2. 鳗鱼繁殖建模:
**代理属性定义:**
- $R_{s_i}$: 代理 $i$ 的繁殖成功率。
- $Rep_{i}$: 代理 $i$ 在当前时间步骤是否繁殖成功。
**繁殖规则:**
$$Rep_{i} = \text{random}(0, 1) < R_{s_i}$$
其中:
- $R_{s_i} = R_{r_i} \times R_{c_i} \times R_{a_i}$,表示代理 $i$ 的繁殖成功率。
- $R_{r_i}$: 代理 $i$ 的基础繁殖率。
- $R_{c_i}$: 代理 $i$ 的繁殖竞争系数,表示资源获取对繁殖的促进作用。
### 3. 鳗鱼性别比例调整建模:
**代理属性定义:**
- $MR$: 当前鳗鱼种群的总体性别比例。
- $BMR$: 基础性别比例。
- $GAR$: 性别比例调整系数。
- $BT$: 性别比例调整的阈值。
**性别比例调整规则:**
$$New\_MR = BMR + GAR \times (E - BT)$$
其中:
- $New\_MR$: 新的性别比例。
- $GAR$: 性别比例调整系数,表示环境对性别比例的影响。
### 4. 寄生虫传播建模(假设):
**寄生虫代理属性定义:**
- $P_{s_i}$: 寄生虫代理 $i$ 的寄生成功率。
- $Infect_{i}$: 寄生虫代理 $i$ 在当前时间步骤是否成功寄生。
**寄生虫传播规则:**
$$Infect_{i} = \text{random}(0, 1) < P_{s_i}$$
其中:
- $P_{s_i}$: 寄生虫代理 $i$ 的基础寄生成功率,可能与鳗鱼性别相关。
```python
import random
class Lamprey:
def __init__(self, resource_need, reproduction_rate, reproduction_competition, gender_ratio_adjustment, gender_threshold):
self.resource_need = resource_need
self.reproduction_rate = reproduction_rate
self.reproduction_competition = reproduction_competition
self.gender_ratio_adjustment = gender_ratio_adjustment
self.gender_threshold = gender_threshold
self.gender = random.choice(['M', 'F'])
self.reproduction_status = False # Initially not in reproductive state
def initialize_population(population_size):
return [Lamprey(random.uniform(0.5, 1.5), random.uniform(0.1, 0.5), random.uniform(0.1, 0.5), random.uniform(0.01, 0.1), random.uniform(0.5, 1.5)) for _ in range(population_size)]
def calculate_resource_acquisition(agent, environment_availability, competition_factor, neighbor_resources):
acquired_resource = agent.resource_need * environment_availability - competition_factor * sum(neighbor_resources)
return max(0, acquired_resource)
def calculate_reproduction_success(agent, acquired_resource):
reproduction_success_rate = agent.reproduction_rate * agent.reproduction_competition * acquired_resource
return random.random() < reproduction_success_rate
def adjust_gender_ratio(base_male_ratio, gender_adjust_factor, environment_availability, base_threshold):
new_male_ratio = base_male_ratio + gender_adjust_factor * (environment_availability - base_threshold)
return max(0, min(1, new_male_ratio))
#省略部分见完整版
for agent in population:
if agent.gender == 'M' and random.random() > new_male_ratio:
agent.gender = 'F'
elif agent.gender == 'F' and random.random() > (1 - new_male_ratio):
agent.gender = 'M'
return population, new_male_ratio
# Example simulation parameters
initial_population_size = 100
environment_availability = 1.0
competition_factor = 0.2
base_male_ratio = 0.5
gender_adjust_factor = 0.1
base_threshold = 0.8
# Initialize population
population = initialize_population(initial_population_size)
# Run simulation for multiple time steps
male_ratios_over_time = []
for _ in range(10):
population, male_ratio = simulate_one_time_step(population, environment_availability, competition_factor, base_male_ratio, gender_adjust_factor, base_threshold)
male_ratios_over_time.append(male_ratio)
# Print final population
for agent in population:
print(f"Gender: {agent.gender}, Reproduction Status: {agent.reproduction_status}")
# Print male ratio over time
print("Male Ratios Over Time:", male_ratios_over_time)
```
可视化:
1. **散点图:** 显示代理之间的关系。可以考虑画出代理的资源获取与繁殖成功率之间的散点图,以观察是否存在某种关联。
```python
def plot_resource_vs_reproduction(population):
resource_acquisitions = [calculate_resource_acquisition(agent, environment_availability, competition_factor, [random.uniform(0, 2) for _ in range(5)]) for agent in population]
reproduction_success_rates = [calculate_reproduction_success(agent, resource_acquisition) for agent in population]
plt.scatter(resource_acquisitions, reproduction_success_rates, alpha=0.5)
plt.xlabel('Resource Acquisition')
plt.ylabel('Reproduction Success Rate')
plt.title('Scatter Plot of Resource Acquisition vs. Reproduction Success Rate')
plt.show()
# 在每个时间步骤后调用
plot_resource_vs_reproduction(population)
```
2. **直方图:** 显示代理属性的分布情况。例如,可以画出资源获取量的直方图,观察鳗鱼种群中资源获取量的分布情况。
```python
def plot_resource_distribution(population):
resource_acquisitions = [calculate_resource_acquisition(agent, environment_availability, competition_factor, [random.uniform(0, 2) for _ in range(5)]) for agent in population]
plt.hist(resource_acquisitions, bins=20, alpha=0.5)
plt.xlabel('Resource Acquisition')
plt.ylabel('Frequency')
plt.title('Histogram of Resource Acquisition')
plt.show()
# 在每个时间步骤后调用
plot_resource_distribution(population)
```
3. **箱线图:** 可以用于显示代理属性的分布和离群值。例如,你可以画出鳗鱼的年龄分布箱线图,以观察年龄的中位数、四分位数范围和异常值情况。
```python
def plot_age_distribution_by_gender(population):
male_ages = [agent.age for agent in population if agent.gender == 'M']
female_ages = [agent.age for agent in population if agent.gender == 'F']
plt.boxplot([male_ages, female_ages], labels=['Male', 'Female'])
plt.ylabel('Age')
plt.title('Boxplot of Age by Gender')
plt.show()
# 在每个时间步骤后调用
plot_age_distribution_by_gender(population)
```
More from this creator